1. Introduction
1.1. To start using the service, please complete the registration form.
1.2. After completing the form you will be granted access to your personal cabinet. You can use Attack Index analytical tools there.
1.3. The Attack Index is an integrated media threat indicator that takes into account such factors as general media activity, competitors’ activities, average background deviations, media attacks in progress and their stages, the history and development of a negative tone in publications, and the degree of information processes randomness;
1.4. Upon registration, you will get UNO — a free starter package that demonstrates the features of the service and shows you latest updates on recent events for any study object.
1.5. Generated reports and requests stored in the user cabinet. You can access them at any time, even after subscription expires.
1.6. Don’t forget to refer to the short glossary – a list of terms we use in our reports (it’s always available in the top bar).
2. Query
2.0 When making a request, we recommend entering up to 3-5 keywords and not selecting all source databases at the same time. It is not necessary to fill in all fields. Case is not taken into account. All the words that should be mentioned in the text are indicated through a comma, through a space – words that are no more than 1 word apart from each other.
2.1 When filling in the fields, consider their purpose. Advanced information about each field will appear when you hover over the (i) symbol.
2.2 In the first field (Keywords), write the name or title of the research object/person you want to research. The system searches for information by keyword, taking into account the possibility of partial matches.
2.3 If you want to search for mentions without simplifications, exactly as it is written, enter them in the second line (Exact keywords). This can be very important if the keyword must not be canceled or be part of another word. For example: Oki, SAM, PR, ERC.
2.4 Indirect or additional topics or clarifications can be written in the third line (Clarification). For example, it can be a type of product or an activity area with which the research object is most closely related.
2.5 If you know that you definitely do not need to take into account among the publications, write them in the fourth line (Exclude) – for example, the object of the study definitely does not play any sport or belongs to a specific city. You can also exclude a certain date from the study by presenting it in the YYYY.MM.DD format.
2.6 In the request, you can choose the language of publications (Cyrillic or Latin sites), regional affiliation and type of information database (site monitoring database; blogs, forums, social networks; TV/radio companies). You can also view the occupied territories of Ukraine separately.
2.7 It is recommended to use only one of the bases when making a request – Cyrillic or Latin. Cyrillic – for Ukrainian and Russian, Latin – for English, for example;
2.8 In the fields with dates, select the time interval during which the information space for the research object should be studied. The analytical system uses machine learning and provides relevant data for a certain period, the minimum training period is 1 month. If necessary, current publications can be viewed in the information picture for each date.
2.9 The “Tracking” function will automatically send a request once a day. The system will send notifications about the appearance of new publications and the current value of the Attack Index score to the e-mail address specified in the profile. A dynamic report will be available in which the history of score changes will be graphically displayed.
2.10 Before starting “Tracking”, check the keywords that will be tracked through a regular query with a selected period of at least 6 months! In order to make sure that there is enough data for their research and the selection of site materials is correct. The “cost” of the tracking function is 30 details.
3. Study object report
3.1. The report is a system of analytical indicators of information danger for the object of research. Each “puzzle” is a part of the report. You can open one or all of them at once by clicking the arrow next to the word “Report”.
3.2. Above the panel of parts of the report there are indicators of the number of publications, the engaged audience, the number of positive, negative and neutral publications.
3.3. The Attack Index score ranges from 0 to 10. The higher the score, the greater the signs of information risks for the research object. The interpretation of the obtained score is given in the report.
3.4. The section “Information picture” contains a graph of the distribution of the number of publications by dates of the studied period. Hovering over the peaks shows the number of publications per day. When you click on a date with the mouse, an additional query is generated for the top 30 stories of publications related to this date. The number of stories can be smaller, because very often the research object is mentioned in only one or several stories. The “Information picture” section also shows the top 20 publication sources from the entire query period. If there are more than 1,000 publications, the rating is based on the last thousand published publications.
3.5. The section “Sentiment analysis” shows the ratio of positive and negative publications. When you click on a date with the mouse, the most popular publication of the corresponding tone is displayed. The tonality itself is determined using machine learning. It should be taken into account that it is characteristic of humanity to react more to negative events or phenomena, which is also transmitted by mass media. Therefore, the presence of negative indicators does not always indicate a negative state of the research object. It may be that very positive activities are being conducted in a negative environment (war, fight against corruption, etc.). You will find more detailed instructions on interpreting the tonality graph at the link.
3.6. The “Sources characteristics” section contains information about sources with publications relevant to the query results: editorial quality by degree of objectivity, degree of uniqueness of content, frequency of placements, form of ownership, thematic category, countries.
3.7. “Trends” graphically represents the deviation from the average level of mention of an object over a period. The maximum deviation is shown in yellow saturated color, the average level is shown in green. For example, there should be bursts of information during the period of planned events (press conference, interview). When you move the cursor over the graph, you can see the date on which the corresponding information activity falls. The top 20 sources are rated for the peak of the greatest information activity. If necessary, each burst can be investigated with an additional query due to the narrowing of the time interval of the investigation.
3.8. The “Information Operations” section shows detected moderated waves of information. The higher and more uniform the red area of the wave graph is, the more the situation around the research object corresponds to the information operation.
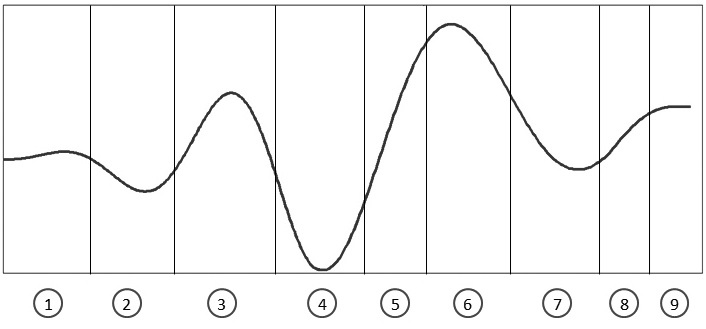
Information operation life cycle stages: 1 – background; 2 – quiet stage; 3 – “preparation fire”; 4 – quiet stage; 5 – attack/growth trigger; 6 – the peak of unrealistic expectations; 7 – disillusion; 8 – social awareness; 9 – productivity/background
The graph “Contour map of information operations” allows you to understand in detail the dates of the beginning and fading of the detected waves caused by information influences. The more saturated the red color, the more signs of an information operation. The system analyzes the presence of an information operation lasting from 7 to 30 days. When you move the cursor vertically by date, you can see the maximum value of the probability of coincidence of information dynamics with the classic pattern of information operation. The maximum value of the information operation parameter can be monitored (takes values from 0 to 100). This value corresponds to the number of days K during which the main phases of the operation took place.
For the identified areas and dates of information operations, the following are presented: top-5 information stories of relevant operations and top-10 resources – information distributors.
3.9. The “Links of sources” section presents the top 20 sources according to the days of the largest information bursts or information operations. The rating is based on the number of publications on one source. A web of connections shows the interdependence (such as reprints or cross-references) of the 20 most significant objects of an information burst or transaction on a calculated date. The size of the source circle depends on the number of publications. When you click the mouse on the name of the source, the connection for the selected source with others is shown in blue. Solid lines show the strongest connections between sources.
3.10. In the “Stability and forecast” section, the stability of information dynamics is evaluated according to the Hurst method. Hurst coefficient values close to 0.5 indicate the chaos of the process. The closer the value is to 1, the more stable the process, the future behavior repeats the past, the process follows its trend. Sharp jumps in this coefficient indicate the presence of very different heterogeneous processes. It is possible that the investigated time intervals should be increased – to understand the components of the information activity of the investigated object.
If the coefficient allows, the system generates graphs of the development of the situation according to four methods: linguistic-correlational, determination of the crisis situation, determination of the trend of the development of the situation, determination of periodic processes.
- Linguistic correlational method
Prediction is performed by a linguistic prediction method used for natural language processing, in particular for predicting the next words in an utterance if all previous words are known. At the same time, it is considered that the conditional probability of the appearance of the next word depends on the previous words and their sequences. To forecast a time series, as is known, the assumption that the probability and its value are determined by previous values is also used. - The method of determining a crisis situation
The method proposed by D. Sornette is based on the analysis of the regularity of market prices on commodity and stock markets before the crisis. The main idea of this method derives from the analysis of financial time series on the eve of the crisis and consists in the fact that before the crisis these values are characterized by growth according to the power law, complicated by periodic fluctuations that converge to a critical point when the probability of collapse reaches its maximum value. - The method of determining the trend of the development of the situation
Polynomial regression models only the trend development of the time series component. The historical series of data is decomposed by the method of least squares in accordance with the given degree of the polynomial. Polynomial regression can be used in mathematical statistics when modeling trend component processes that develop over time. - The method of determining periodic processes
The method of decomposition into Fourier series allows to find periodic forms of processes, for example, the display of editorial policies of sources in time according to the applied request. Based on the obtained approximate formula, further forecasting takes place.
3.11. The “Quotations” section contains fragments of direct speech present in messages that match the query. More than 1000 quotes are provided in the last week
3.12. The “Tags” section shows those that were found in the requested messages and marked with the “#” symbol. Most tags are usually present on social networks, but can be used on other resources as well
3.13. The “Portraits” section contains a list of named entities – persons and organizations that were mentioned in the messages corresponding to the request. The relationship for the selected object with others is shown.
3.14 The “Geo” section is an interactive geographical map with defined geographical names and their frequency of mention
4. Payment
4.1. Requests are debited from the account as requests are sent. Detailing is written off when clicking on the graphs of dynamics and tonality and opening the titles of the plots.
4.2. Packages differ in the length of the period (in months) for which a review request can be made and the number of reports that can be stored in a personal account.
4.3 The period of activity of packages is 30 days.